

The OVD-Info project began collecting data on detentions in its very first year of operation. We believe that the data we have collected will help understand the structure of civil rights violations within the system, and serve as a foundation for future research in this area.
The dataset includes information on detentions in Moscow starting from 2012 and in Saint-Petersburg from 2013. Information on other regions and annexed Crimea has been available since 2020. Data of 2021 is still preliminary and is currently undergoing verifications and checks (for more details, see here).
It’s important to note that the dataset and its visual representations reflect the number of detentions rather than the number of individuals detained. This distinction is used because the same individual can be detained at different protests within a few days.
Here, we showcase methods and approaches for utilising the dataset. For this purpose, OVD-Info analysts have created plots with detailed information on detentions at public protests. From these, we have gathered certain insights on the state of assembly freedom in Russia from 2020 to 2023. This serves as an example of the potential applications of this dataset. You are encouraged to analyse this data and create your own visualisations.
In the methodology we detail our process for counting detentions and clarify various terms used in the dataset and accompanying plots.
The dataset is available here.
If you have an inquiry about the data or would like to explore a joint project with us, contact us via: data@ovdinfo.org
You can subscribe to updates for researchers and experts. In this newsletter, we inform you about new reports, data and datasets.
We also have a Telegram channel where we share newly acquired data.
Visualisation includes 4 metrics
Number of detentions refers to the count of an individual’s detentions at a specific protest. It’s possible for the same person to be detained multiple times within the same day at a single event or rally; in such cases, each detention is recorded.
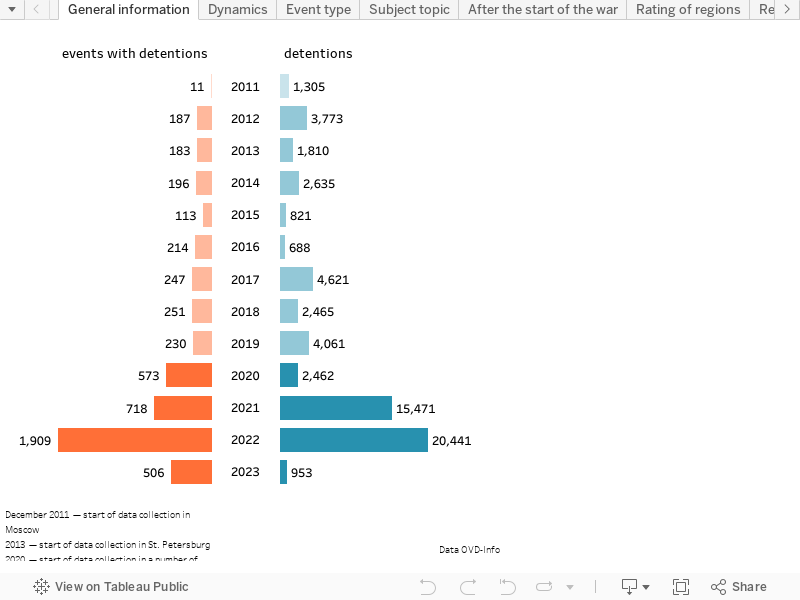
Number of events with detentions indicates the quantity of events during which at least one person was detained. It’s crucial to note that we do not have data on the total number of rallies where no detentions occurred. Therefore, this metric should not be used as a direct indicator of overall protest activity.
Number of detentions per event is the ratio of the total number of detentions to the total number of events, essentially representing the average number of detainees at each public event.
Number of detentions per 100 thousand people measures how the number of detentions relates to the population size of a region in 2021. This figure is calculated separately for each region.
To get detailed information on an event (e.g. its format, cause and whether it was officially approved), you may use filters in plots. More about them is at the bottom of the page.
During the last four years, more than 39 000 detentions took place at public rallies and events.
From 2020 to 2023, law enforcement officers across Russia conducted 39,327 detentions at public events such as pickets, rallies, processions, and other gatherings.
In Moscow, there were 34,789 arrests at rallies over 11 years, from 2012 to 2023. In St. Petersburg, there were 12,586 arrests at rallies over 10 years, from 2013 to 2023.
From 2020 to 2023, most detentions took place because of political protest.
We define political protest as a rally, an event or a single picket where people demand certain system changes from the government and pursue socially important goals — for example, protests against war, high-level corruption, pension reform or changes in the Constitution. During 2020-2023 most of the detentions at rallies happened during these kinds of events.
This chart shows the dynamics in number of detentions, number of events, and an average number of detentions per event in different years.
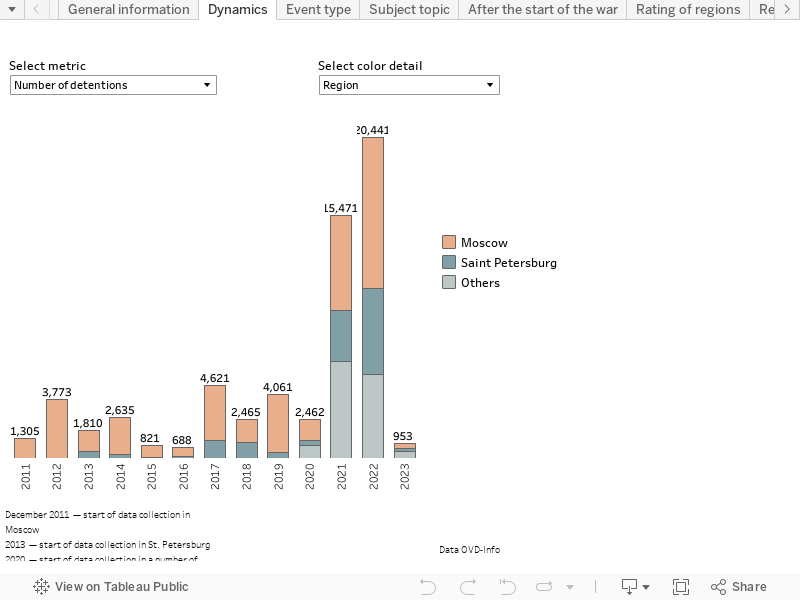
The biggest number of detentions at public events occurred in 2022.
This graph shows the overall dynamics in the number of events and the number of detentions by year. From 2020 to 2023, the most detentions occurred in 2022, when the full-scale war in Ukraine began.
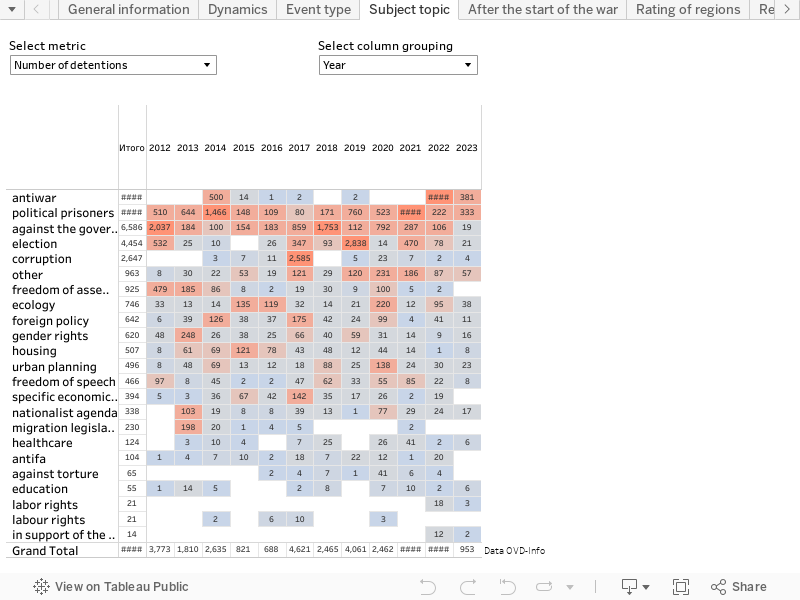
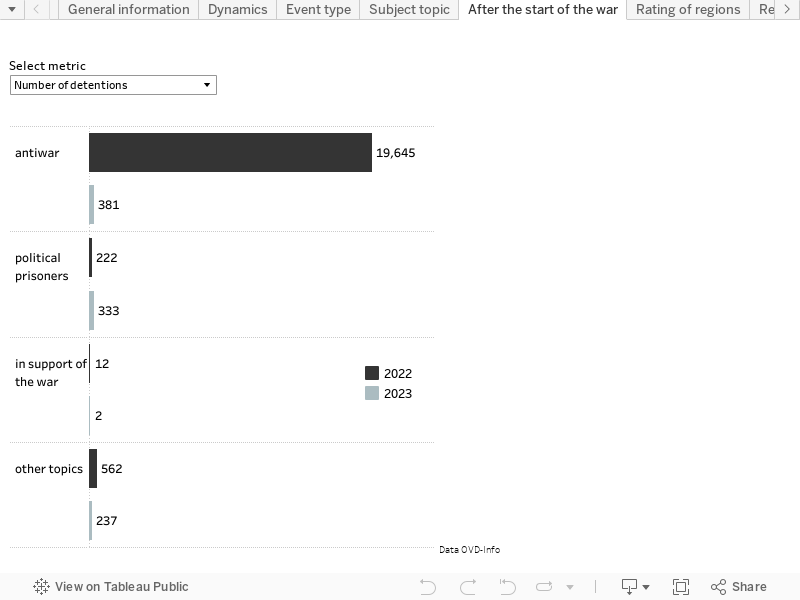
In 2023, the most frequent detentions were due to anti-war rallies and protests in support of political prisoners.
In 2023, anti-war protests topped the list in terms of the number of detentions, followed by rallies in support of political prisoners. The same trend was observed in 2022.
The undisputed leader in the number of detentions in 2021 were the protests in support of political prisoners: numerous protests in connection with Alexei Nalavny’s return and subsequent arrest. These and other trends you can track on the heatmap.
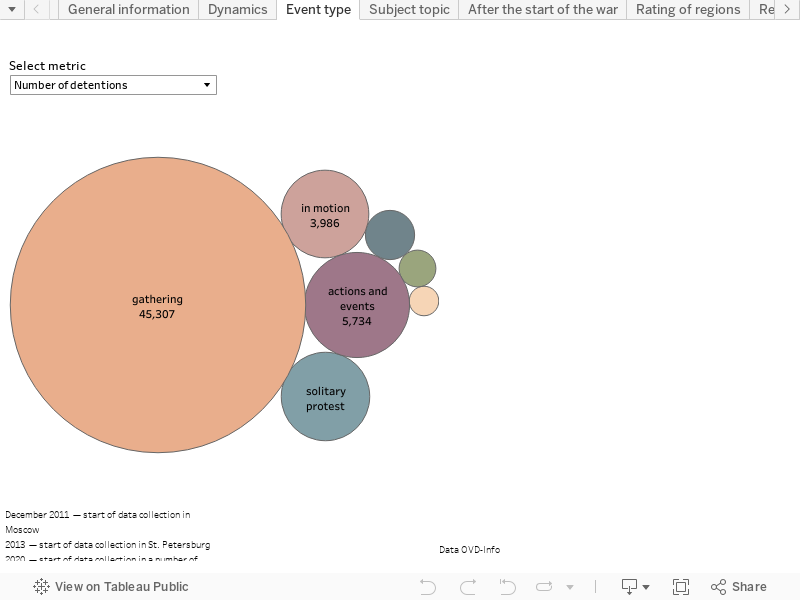
Since 2020, people have been regularly detained because of solitary protest. By law there is no requirement to have them pre-approved by authorities.
In 2020, in response to the COVID-19 pandemic, authorities imposed restrictions which included the prohibition of rallies, marches, and other mass gatherings. In turn, individuals began to engage in solitary protests and other forms of individual action that do not require authorization from the authorities. Despite the non-violent and compliant nature of these actions, detentions continued to occur. As a result, while the total number of actions involving detentions saw a significant increase, the overall number of detainees experienced a decrease.
From that moment until the end of 2023, a solitary protest has been the form of protest that most often became a reason for detention.
The graph below shows how the number of detentions and events with detentions has changed depending on their format: a gathering, a solitary protest, in motion (e.g. march), and others. To see this, you need to click on any circle, and then the dynamics of the selected metric and event format by year will appear.
It can also be seen that detentions in 2021 frequently happened before or after events. In 2022, there were fewer such detentions, while the total number of detentions increased.
Most of the events, where detentions took place, were refused by authorities for approval.
For instance, irrespective of the region, underlying cause, level of demand, and organisers, the majority of events between 2020 and 2023 where detentions occurred were not sanctioned by authorities. This lack of approval provided authorities with a pretext to label these events as «illegal.» For a more detailed analysis, refer to the «Dynamics» graph, utilising the filters for «Detentions» and «agreement»
Rating of detentions in the regions, not only Moscow and St. Petersburg.
This graph shows the rating of regions where people were most often detained at rallies from 2020 to 2023.
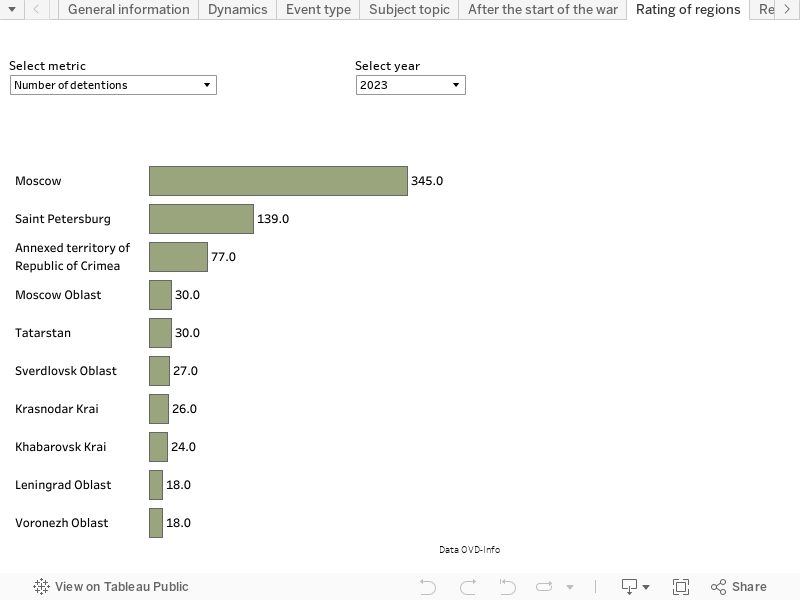
In 2020, despite the undisputed leadership of Moscow and St. Petersburg, Khabarovskiy Krai was in third place in terms of detentions at rallies: residents were protesting against the arrest of former governor Sergei Furgal.
Throughout 2020-2023, the top 10 regions where people were most often detained at rallies always include Krasnodarskiy Krai and Tatarstan. In addition, Tatarstan took third place in 2021, when mass protests in support of Navalny took place with numerous detentions. Krasnodarskiy Krai ranked fourth in the same year.
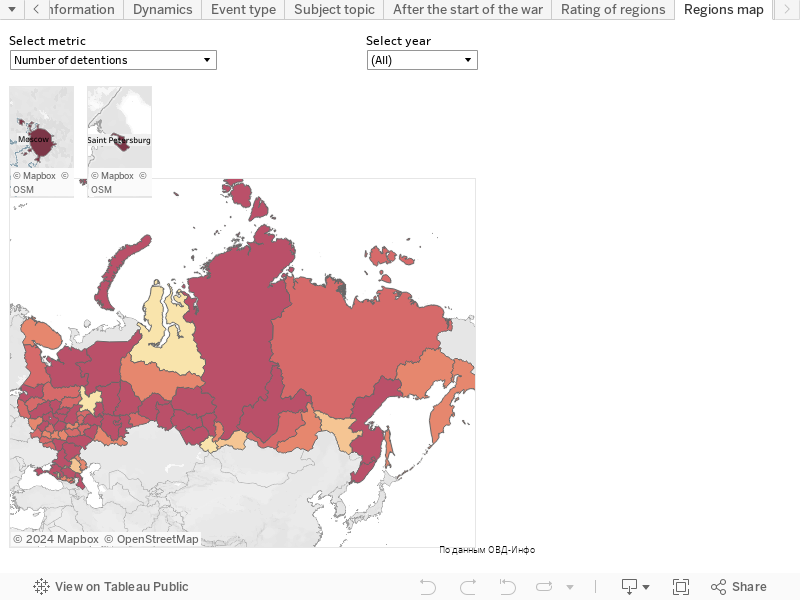
Regions map
The map shows the regions where we collected information about detentions in 2020-2023. Each subject is coloured differently: the darker the shade, the more detentions there were.
FILTER DESCRIPTION
«Select metric» shows either the number of detentions or the number of events with detentions.
«Select colour detail» — this filter separates the data by region and by the attributes of the events: authorities approval, type, demand level, organiser type.
«Select column grouping» — is located on the heatmap «Cause». The filter shows the division of data by year, region, or attributes of the events: Authorities approval, type, demand level, organiser type.